Give you insights into the general picture with aggregated reports or the detailed picture with individual data records.
Tellma ERP™ Business
Intelligence and Analytics.
Keep abreast of your business operation, bring all your data to your fingertips, on the go and in real time and drill through from any figure to the source data with the tap of a button. Tellma ERP is engineered for powerful reporting, it features a state-of-the-art integrated business intelligence and analytics platform that is helping executives and managers around the world stay on top of their operation and drive informed business decisions.
Request a Demo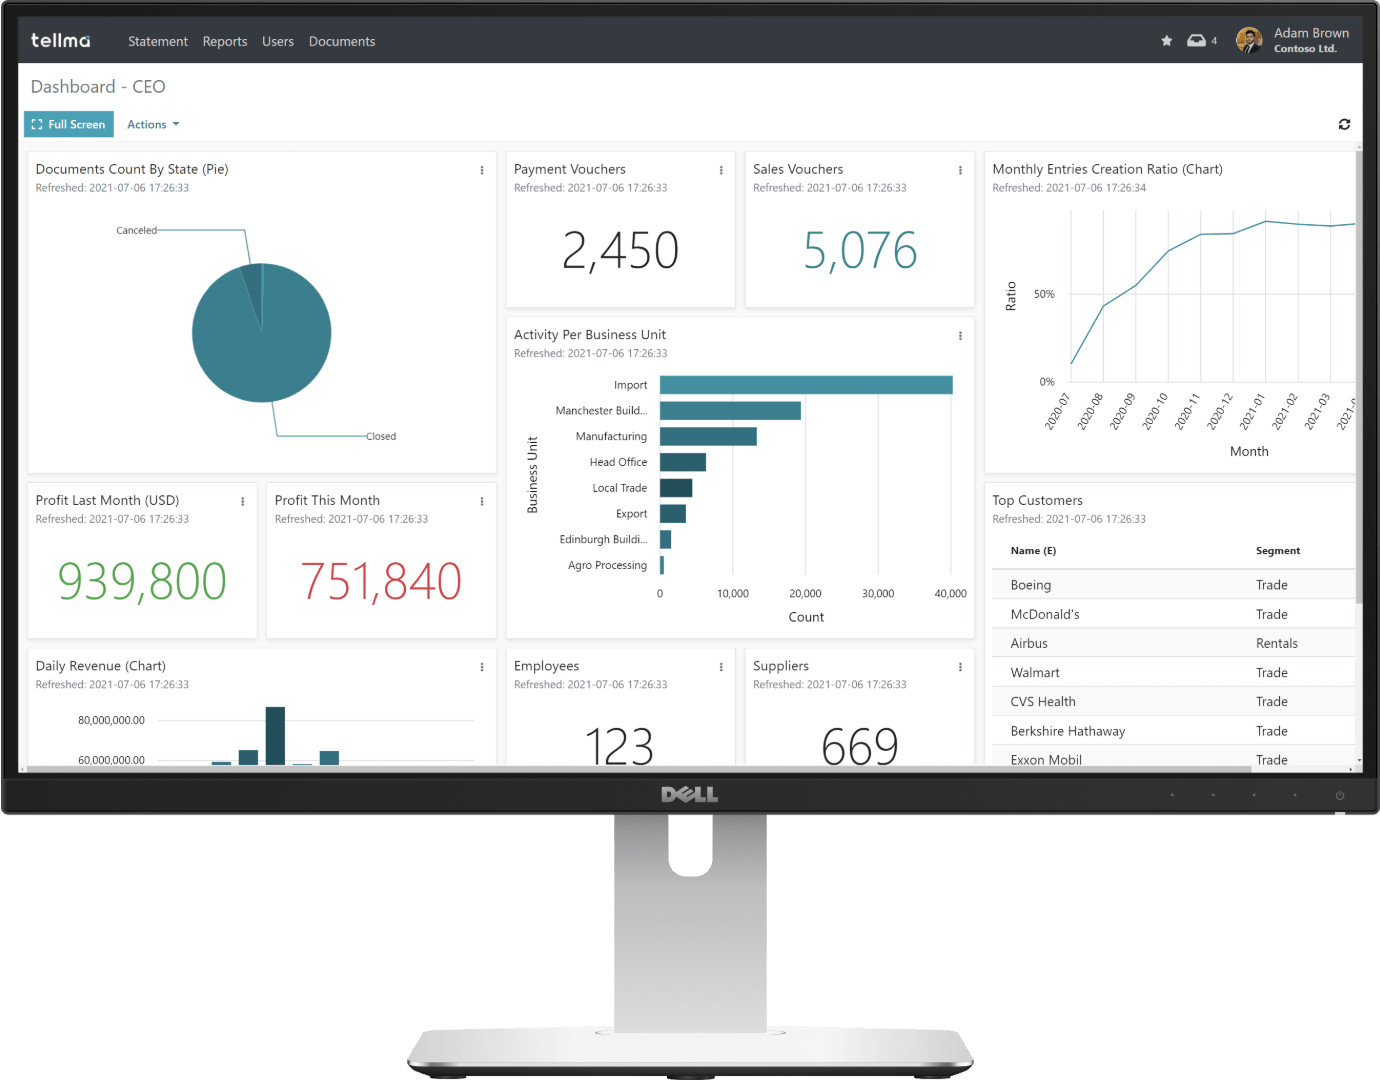
Tellma's Business
Intelligence Overview.
Tellma Business Intelligence platform provides enterprise power users with the ability to create as many as thousands of custom canned and ad hoc financial, managerial, and audit reports that are tailored to the needs of every department and user. Every report takes minutes to build using a familiar pivot-table like experience complemented by a simple yet powerful query expression language.
Tellma ERP business intelligence can:
1
2
Support drilling through to the source data by clicking on any value.
3
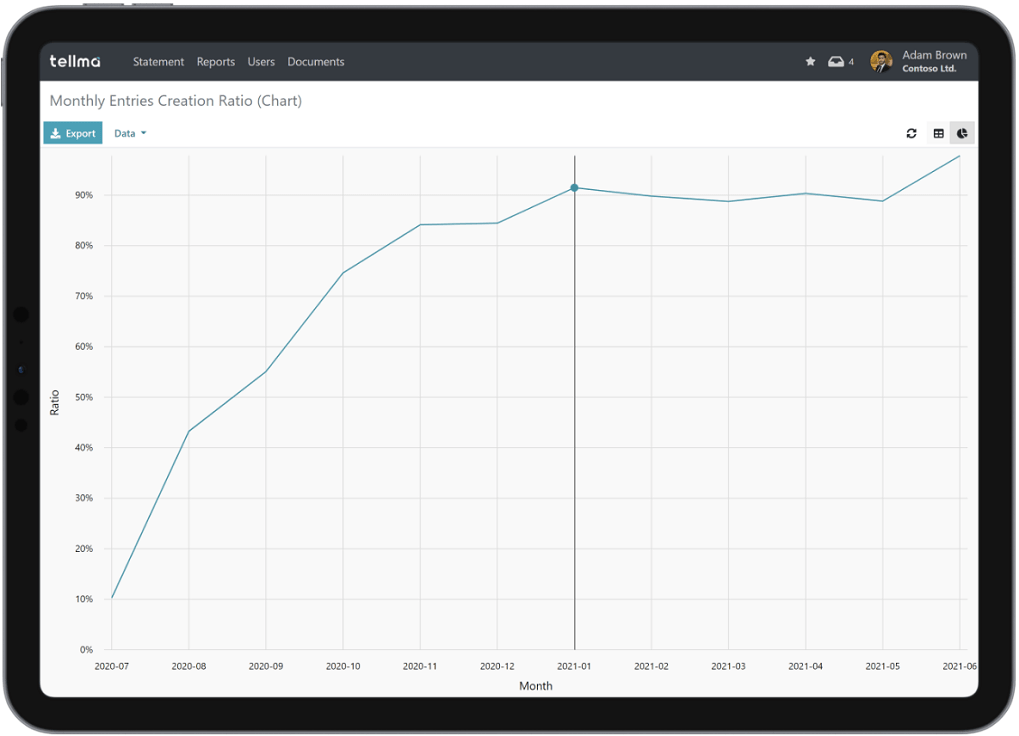
Present the reports in a tabular or graphical format using one of the many built-in charts.
4
Provide real-time analytics and insights based on the most recently entered data.
5
Present the reports as standalone screens, embedded widgets, pinned in dashboards, exported, or emailed directly to the users.
Tellma Business Intelligence Lends Power to Decision Makers.
Extract real-time information and insights right from the source and present it exactly how you want it quickly and with ease. Tellma Business Intelligence supports many different reporting formats and styles, tailoring for the needs of every user.
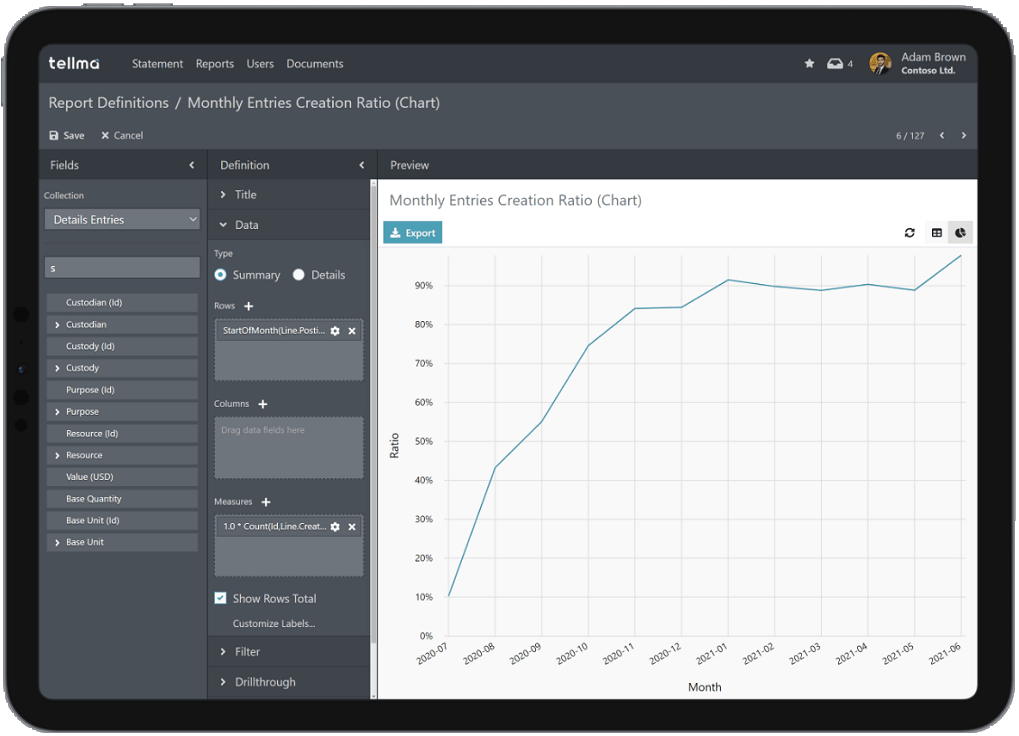
Charts can bring the data to life and allow you to discover patterns or trends that are not as easy to see with tabular formats. Many types of charts are supported. Clicking on any data point will drill the user through to the individual records that make up the clicked data point.
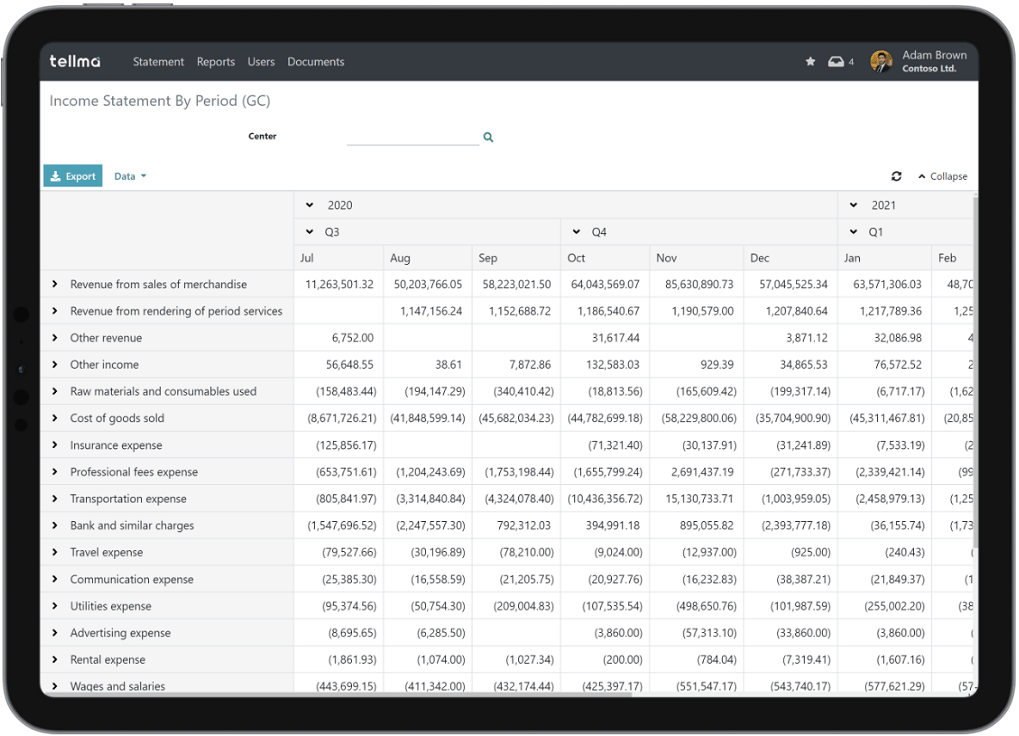
Summary reports aggregate millions of records of data into easy to consume sums, counts and averages grouped by customized dimensions like months or products. Clicking on any figure will drill the user through to the individual records that make up the clicked data point.
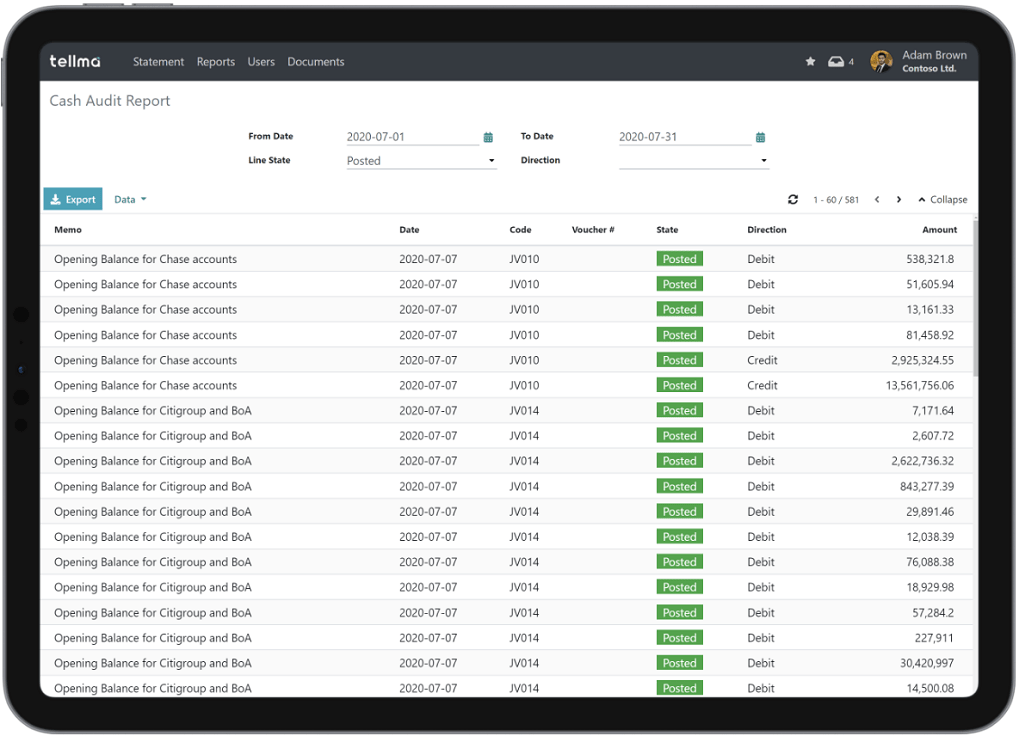
Details reports give you a filtered view over the individual data records, details reports display a selection of columns from the original data records or expressions thereof. Clicking on any record will navigate the user to the details screen of that record where they can inspect who entered the record and who last modified it.
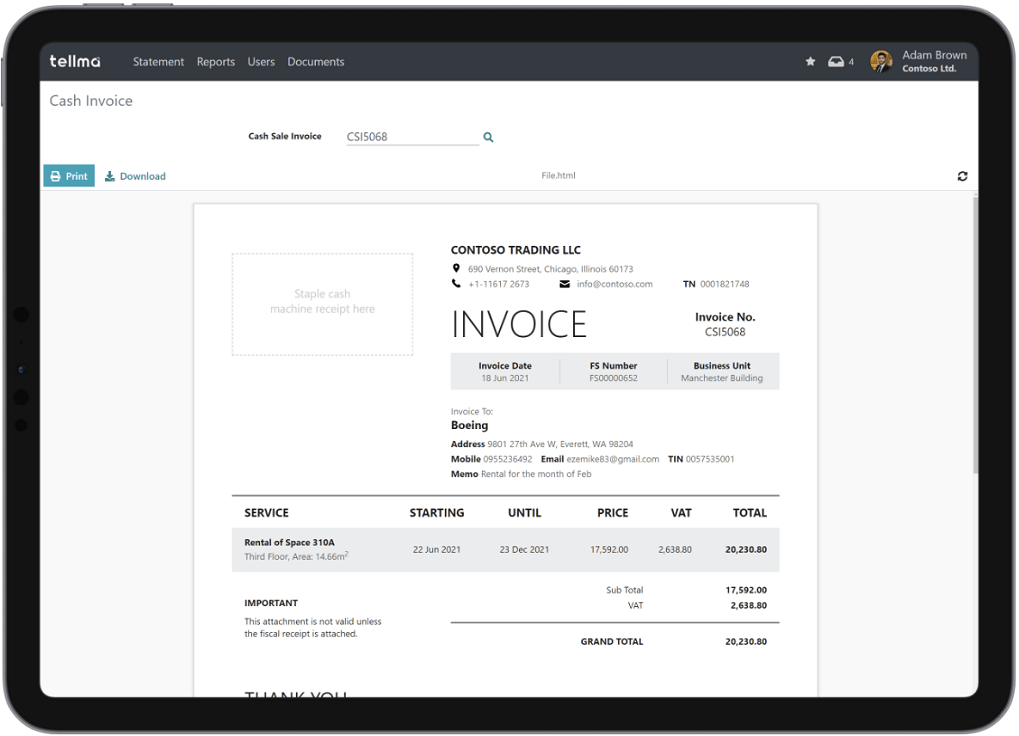
Markup reports are the most flexible, they are built using a markup language such as HTML complemented with a special templating expression language. Markup reports can be freely themed and branded, flexibly arranged, printed, exported, or emailed to specific destinations manually or based on a schedule.
How Tellma Business Intelligence Works.
Under the hood, the Tellma Business Intelligence platform relies on a simple but powerful query expression language like that of Excel. This expression language can be used to define parameters, measures, dimensions, attributes, and filters that makeup a summary report. The resulting report can then be enhanced with custom multi-lingual labels, sorting, aggregate value filters, color-highlighting, custom value formatting and more, giving the power user the ability to create any financial, managerial or audit report in minutes. The report can be pinned on the main menu to appear for members of a certain role, contextually embedded in other details screens, or pinned in dashboards. Through no additional effort, every report supports data export, drill through to the source, and row level security. The Business Intelligence platform is a productivity boon for both the report designer and consumer.